Design Process
Design Process
A case study to showcase my design process
A case study to showcase my design process
Overview
Overview
In this project, the profile section was redesigned to better align with the evolving scope of the platform. The updated design improved organization and discoverability, making accessing key features and information easier. This project will be presented to demonstrate the design process and the steps taken to achieve these results.
In this project, the profile section was redesigned to better align with the evolving scope of the platform. The updated design improved organization and discoverability, making accessing key features and information easier. This project will be presented to demonstrate the design process and the steps taken to achieve these results.
Problem
Problem
The existing profile section no longer reflected the expanded scope of the platform, making it challenging for users to locate and interact with key features and information effectively.
The existing profile section no longer reflected the expanded scope of the platform, making it challenging for users to locate and interact with key features and information effectively.
Goal
Goal
Redesign the profile section to create a well-organized, user-friendly interface that enhances discoverability and aligns with the platform’s evolving functionality.
Redesign the profile section to create a well-organized, user-friendly interface that enhances discoverability and aligns with the platform’s evolving functionality.
Process
Process

Benchmarking
Benchmarking
The first step was benchmarking, involving the analysis of seven crypto platforms to examine the categories and structures used in their profile sections. This step is crucial for understanding industry norms and identifying opportunities to create a more intuitive user experience.
The first step was benchmarking, involving the analysis of seven crypto platforms to examine the categories and structures used in their profile sections. This step is crucial for understanding industry norms and identifying opportunities to create a more intuitive user experience.


User Interviews
User Interviews
The next step involved speaking with both customer service and real users to gather data on pain points.
A series of interviews with customer service provided curated feedback, while real users shared unfiltered inquiries.
The insights from customer service were as valuable as the user input, as users often don’t present issues with clear solutions in mind.
For example, a user might say, "I couldn’t customize this setting," while customer service might clarify, "They couldn’t find the section."
User Queries

CX Suggestions


User Behavior Analysis
User Behavior Analysis
User feedback from the support channel was reviewed to compile a list of suggested fixes for the profile section. Amplitude, a product analytics tool, was then used to analyze user behavior within the profile. By identifying key patterns and trends, insights were gathered to inform the redesign. All potential fixes, from both user feedback and Amplitude data, were then ranked based on priority.
User feedback from the support channel was reviewed to compile a list of suggested fixes for the profile section. Amplitude, a product analytics tool, was then used to analyze user behavior within the profile. By identifying key patterns and trends, insights were gathered to inform the redesign. All potential fixes, from both user feedback and Amplitude data, were then ranked based on priority.
User Persona
User Persona
New user personas were created based on the data gathered from interviews, feedback, and analytics. These personas were designed to contrast significantly, representing three very different user types to ensure the redesign addressed a diverse range of needs and behaviors.
New user personas were created based on the data gathered from interviews, feedback, and analytics. These personas were designed to contrast significantly, representing three very different user types to ensure the redesign addressed a diverse range of needs and behaviors.

User Journeys
User Journeys
A user journey was created to map out a simple task, such as modifying account limits, selected to evaluate the user experience within the profile section. Pain and pleasure points were identified at each stage to assess how the profile section supports user needs. A second journey was created to depict the end goal, highlighting how the redesigned profile section enhances task completion and improves the overall user experience.
A user journey was created to map out a simple task, such as modifying account limits, selected to evaluate the user experience within the profile section. Pain and pleasure points were identified at each stage to assess how the profile section supports user needs. A second journey was created to depict the end goal, highlighting how the redesigned profile section enhances task completion and improves the overall user experience.


Card Sorting
Card Sorting
Card sorting was conducted with 15 participants to understand how they would expect the profile section to be organized. Using the categories developed during the benchmarking phase, participants sorted cards representing different profile elements into groups they felt made the most sense. If the provided cards didn’t fully capture their ideas, participants had the option to create their own.
Card sorting was conducted with 15 participants to understand how they would expect the profile section to be organized. Using the categories developed during the benchmarking phase, participants sorted cards representing different profile elements into groups they felt made the most sense. If the provided cards didn’t fully capture their ideas, participants had the option to create their own.


Notetaking
Notetaking
During the card sorting sessions, all results were recorded in Figma, visually documenting each participant’s sorting decisions along with their comments and feedback. This approach captured their thought processes and insights, which will be analyzed to identify patterns and trends, ultimately informing the development of a more intuitive information architecture for the profile section.
During the card sorting sessions, all results were recorded in Figma, visually documenting each participant’s sorting decisions along with their comments and feedback. This approach captured their thought processes and insights, which will be analyzed to identify patterns and trends, ultimately informing the development of a more intuitive information architecture for the profile section.
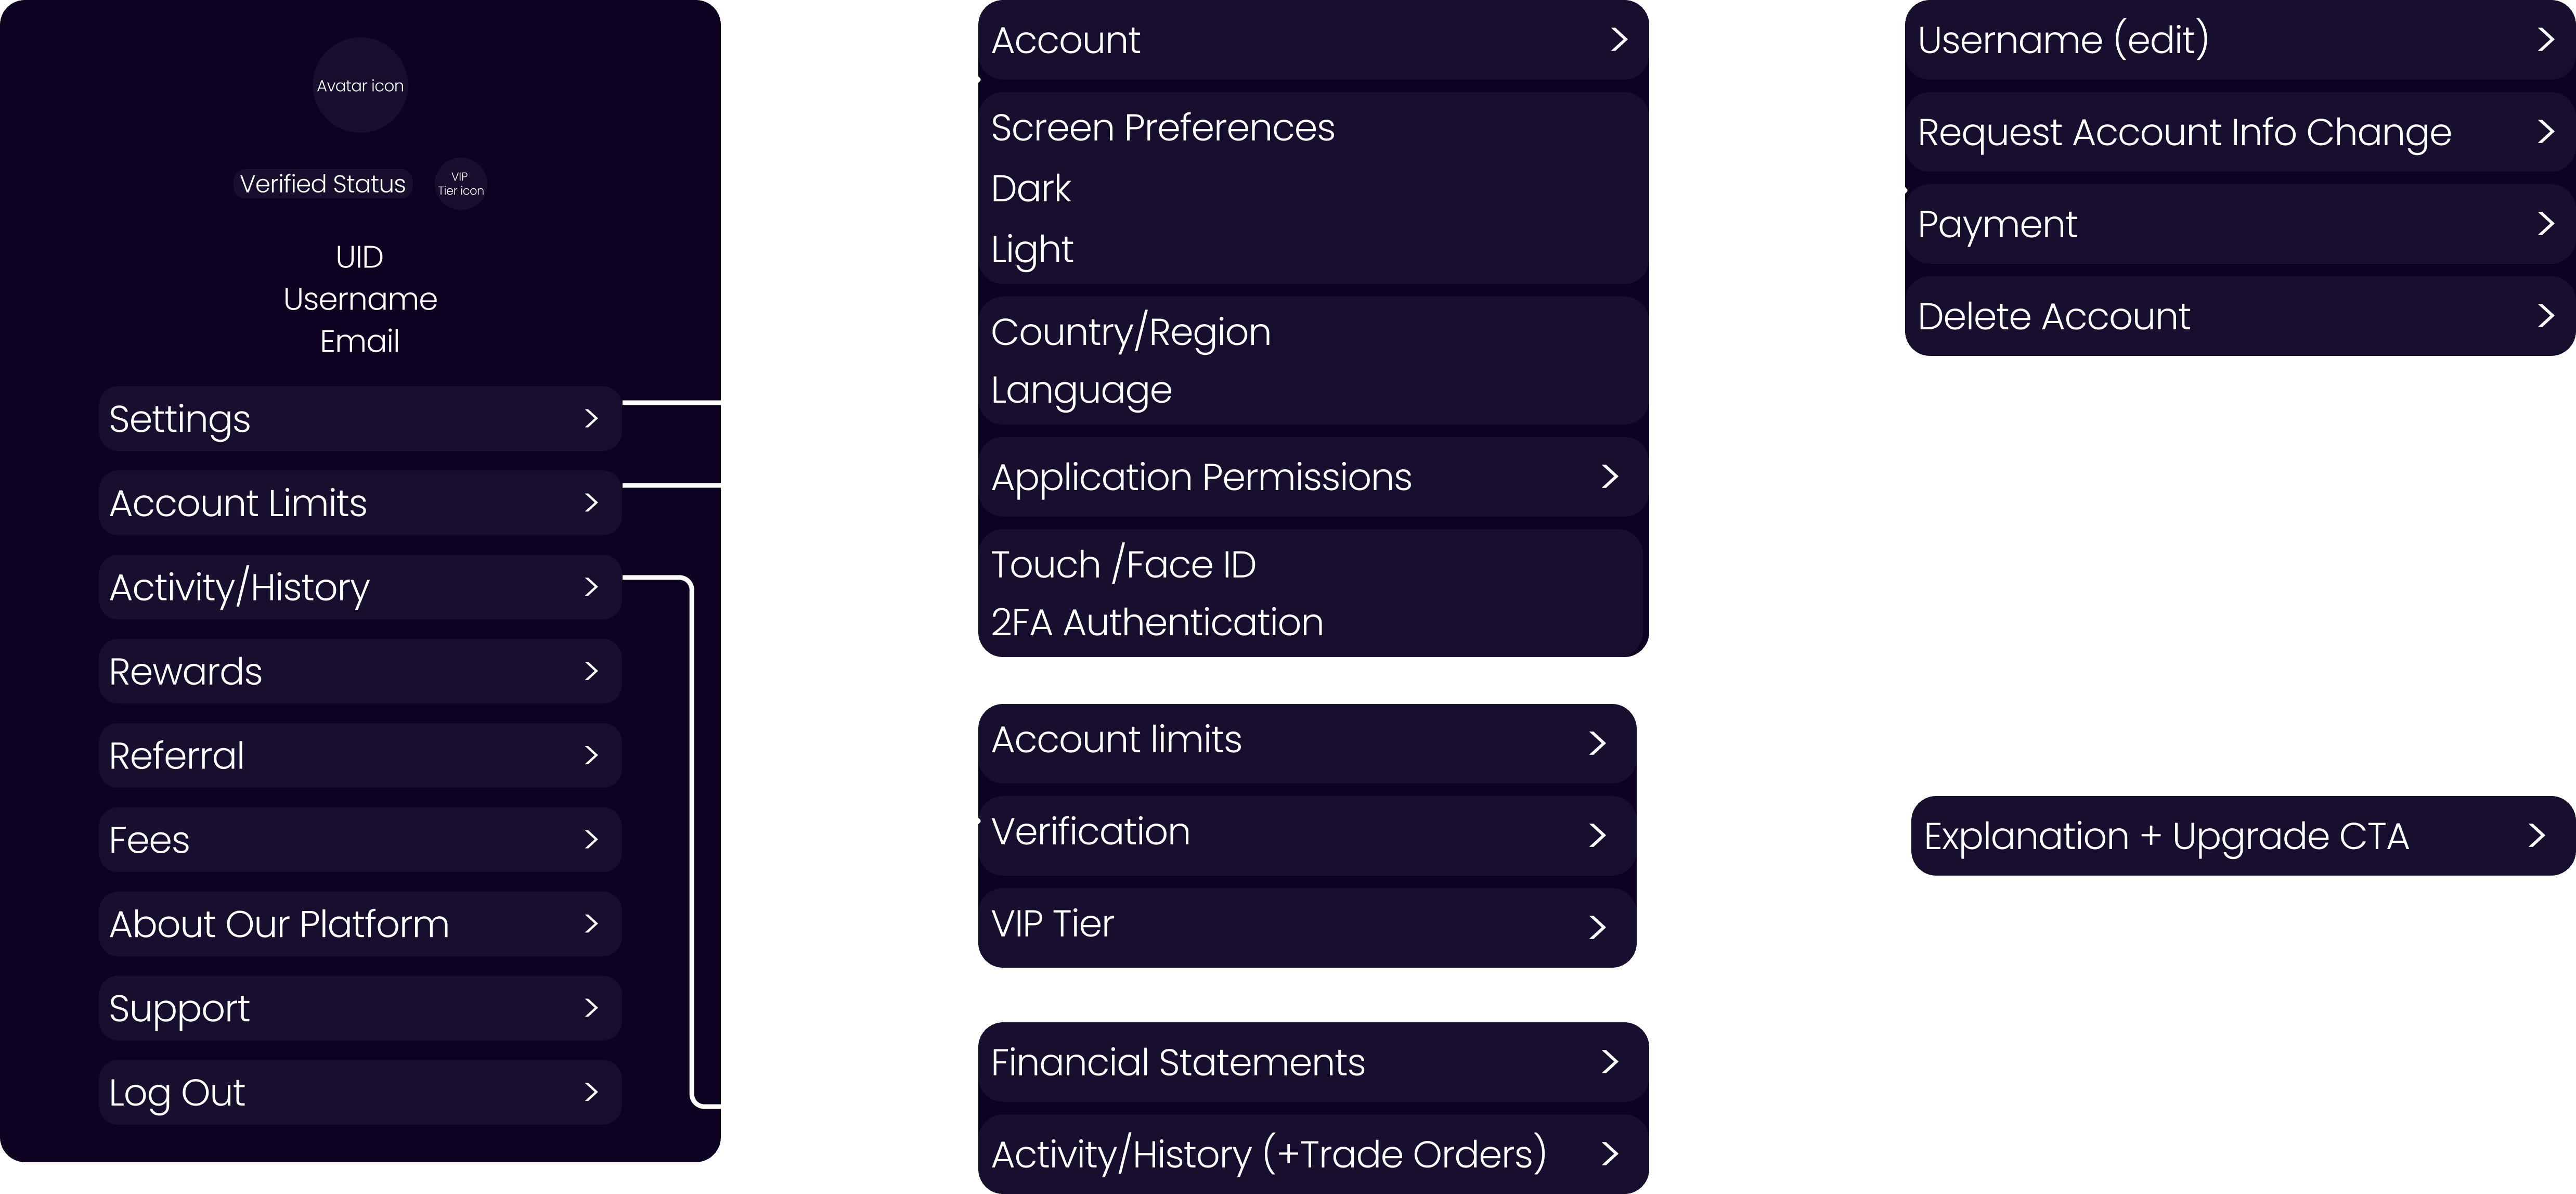
Information Architecture
Information Architecture
The frequency of each category being used as a main category, as well as how often specific items were sorted into them, was recorded in a spreadsheet. The most popular categories and the items most frequently sorted within them were identified, along with any patterns in sorting behavior. This data was then used to inform the creation of a logical and user-friendly information architecture for the profile section.
The frequency of each category being used as a main category, as well as how often specific items were sorted into them, was recorded in a spreadsheet. The most popular categories and the items most frequently sorted within them were identified, along with any patterns in sorting behavior. This data was then used to inform the creation of a logical and user-friendly information architecture for the profile section.
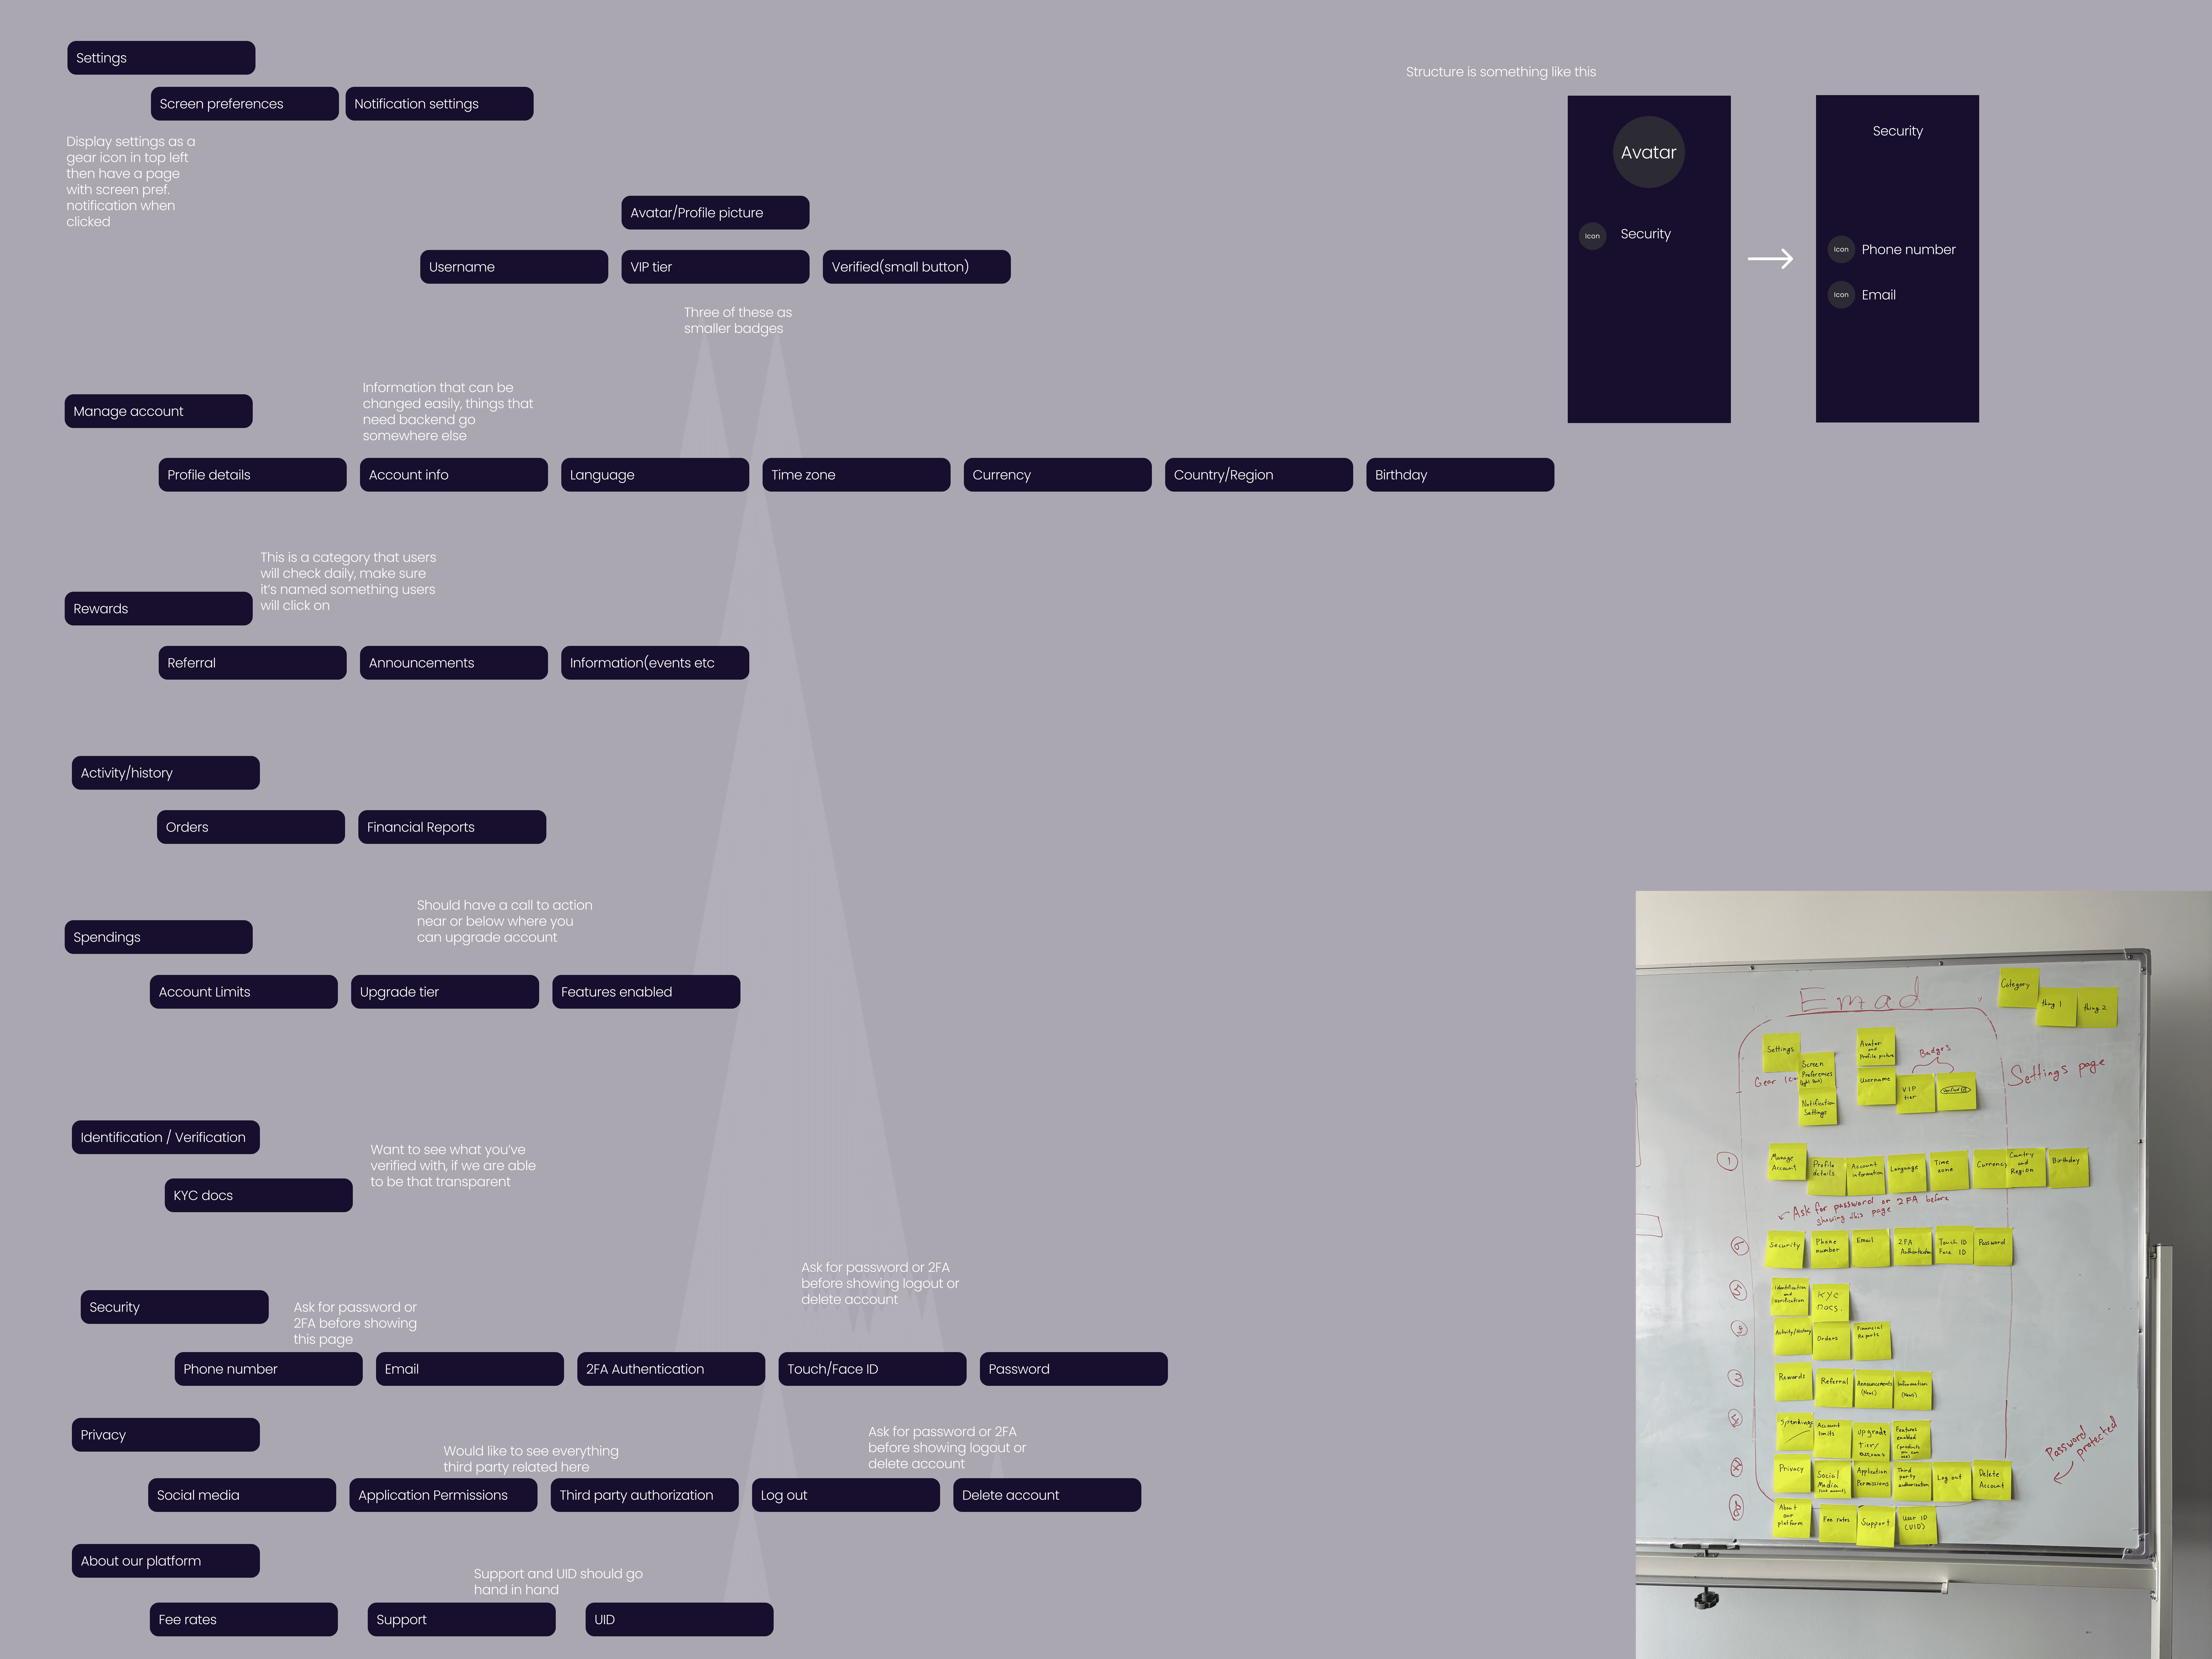
Wireframes
Wireframes
Wireframes were created to explore the layout and structure of the redesigned profile section, focusing on usability and user flow. Feedback from stakeholders helped refine the design before moving to higher fidelity.
Wireframes were created to explore the layout and structure of the redesigned profile section, focusing on usability and user flow. Feedback from stakeholders helped refine the design before moving to higher fidelity.


Prototyping
Prototyping
A prototype was created to test the usability of the redesigned profile section, allowing for real user interactions and feedback to validate design decisions before final implementation.
A prototype was created to test the usability of the redesigned profile section, allowing for real user interactions and feedback to validate design decisions before final implementation.
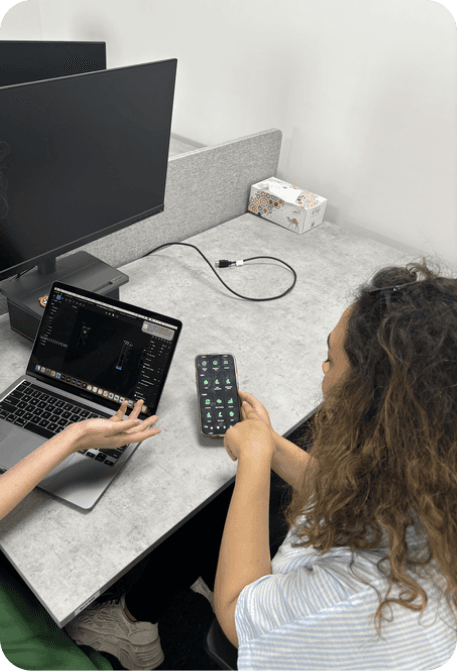
Usability Testing
Usability Testing
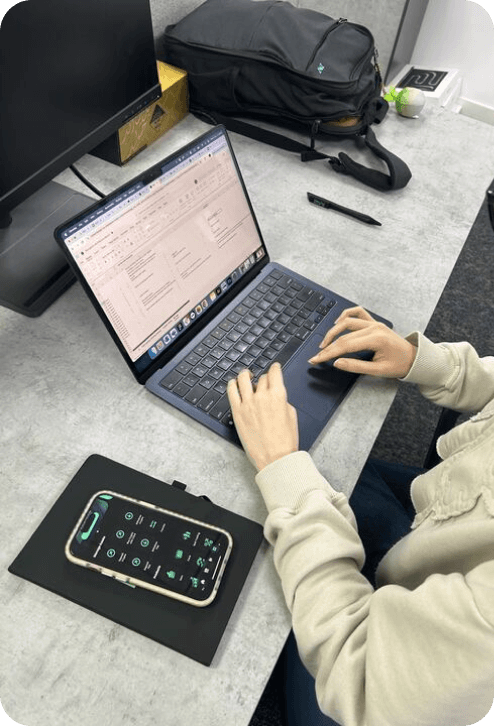
Usability testing was conducted with real users to evaluate the effectiveness of the redesigned profile section. Feedback gathered during testing helped identify pain points and validate design choices, ensuring the final design meets user needs and expectations. Below are photos of the testing being conducted
Usability testing was conducted with real users to evaluate the effectiveness of the redesigned profile section. Feedback gathered during testing helped identify pain points and validate design choices, ensuring the final design meets user needs and expectations. Below are photos of the testing being conducted
High Fidelity Screens
High Fidelity Screens
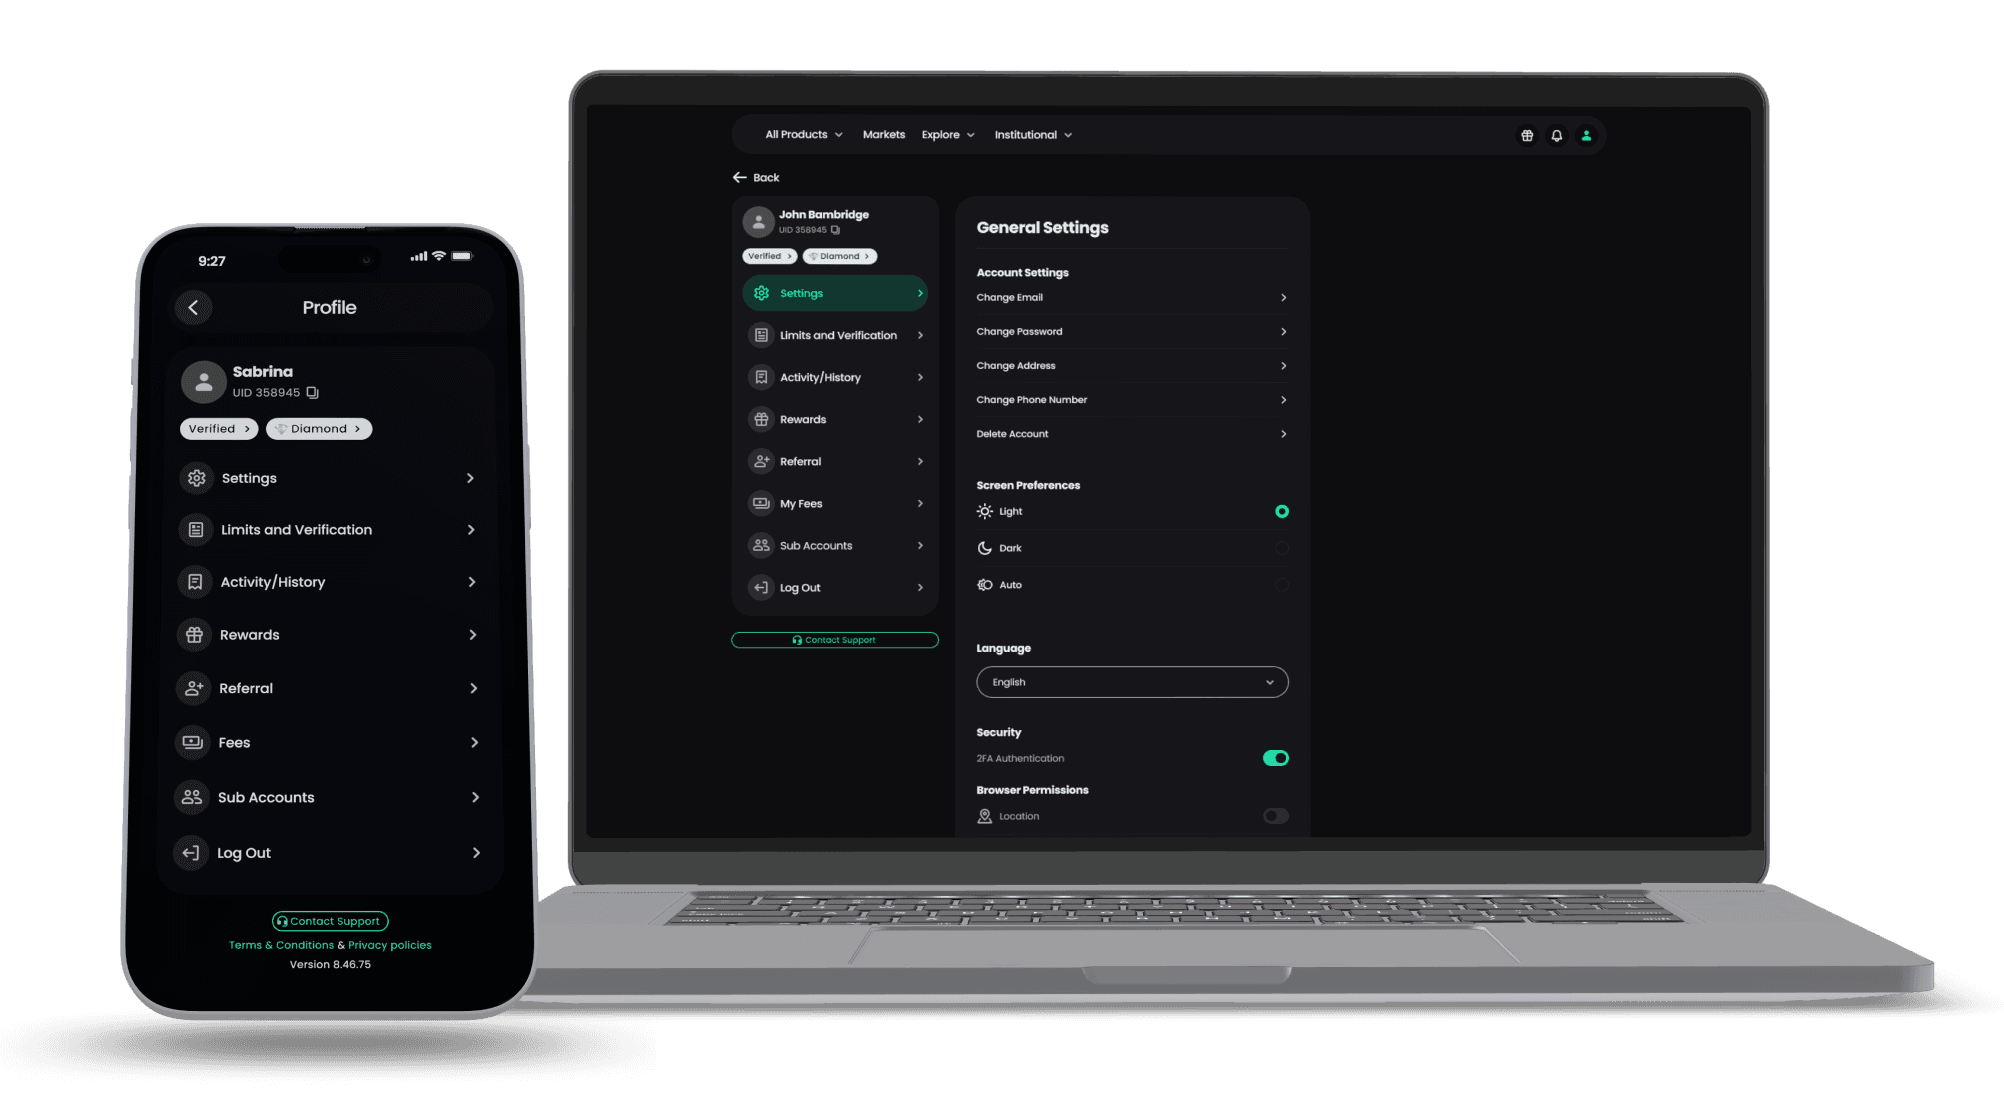
High-fidelity screens were created based on the insights from the entire design process. Fixes from usability testing were implemented, and the screens were tested within the design team before being presented to stakeholders. The profile section was redesigned to better align with the evolving scope of the platform, improving organization and discoverability. The updated design makes it easier for users to access key features and information. From research and benchmarking to wireframing, prototyping, and usability testing, each stage was focused on delivering a more intuitive and user-friendly experience.
High-fidelity screens were created based on the insights from the entire design process. Fixes from usability testing were implemented, and the screens were tested within the design team before being presented to stakeholders. The profile section was redesigned to better align with the evolving scope of the platform, improving organization and discoverability. The updated design makes it easier for users to access key features and information. From research and benchmarking to wireframing, prototyping, and usability testing, each stage was focused on delivering a more intuitive and user-friendly experience.
